Annotation
March 2023
Camera logger image annotation
In this practical, you will learn how to process and annotate the camera data using a simple Python-based Graphical User Interface (GUI). Labelled daily-living data is essential to training many activity recognition models. By going through the process of annotating your own data, you will begin to understand some of the difficulties of simplifying real life to a set of labels.
We have elected to use a simple Python-based GUI for several reasons. Firstly, we wanted to to use an offline tool so that your data can stay on your computer. Secondly, we wanted to minimise the amount of additional software dependencies required to annotate your data. Finally, although there are many more sophisticated image annotations tools out there, each of them require some level of tweaking to do what we want them to do. Instead of spending time trying to understand and adapt an existing tool to our needs, we decided to quickly prototype our own. If any of you wish to try improve the funcitonality of the GUI, we have provided all the source code for you to edit as you wish.
Requirements
Before starting this tutorial, we expect you to have the following:
- A recent version of Python installed on your machine, for instance through installing miniconda.
- The following Python packages:
We went through installing these in the previous practical, but in case you were NOT able to install all of these, here are instructions:
Installation reminder:
Activate the virtual environment you set up yesterday and install pandas, and Pillow.
conda activate sensorsetup
conda install pandas pillow
Check that Tkinter, which should have automatically been installed alongside Python, works on your machine. You can verify this by typing:
python -m tkinter
If Tkinter is correctly set-up, a pop-up window should appear saying, “This is Tcl/Tk version 8.6. This should be a cedilla: ç”. The exact version number does not matter too much, provided it is relatively recent. If this is NOT working, see TkDocs. One potential fix is to install it using conda by running:
conda install -c conda-forge tk
Practical code
We have also prepared code for this practical. This can be found here on GitHub.
Either clone or download the repository to your computer and take note of where you save it to. You will later have to navigate to the Python scripts in it. The code may have changed since yesterday’s practical - it is worth re-downloading the code to up to date with the most recent version.
0. Downloading your data
0.1 Downloading camera data
Collect a micro-USB cable from your tutors.
Take off the camera and plug it into your computer using the provided cable and make a note of the camera directory (e.g., D:/ for Windows, and /Volumes/ for Mac)
From the Anaconda prompt (Windows), or terminal (Mac), navigate to the scripts directory that we have downloaded. It should under RMLHDS/0_SensorSetup/scripts/. We will use the autographer.py script to download your data. Start the sensorsetup virtual environment that you created.
Mac
Run the following to download your data:
python autographer.py --download True
Once you have downloaded your data, you should have a folder of .JPG files of all the activities you have been up to since you started wearing the camera. By default, this will be in the scripts/camera/test folder. Check that you have successfully downloaded your data
To then wipe the data from your camera, run:
python autographer.py --delete True
Windows
Run the following to download your data:
python autographer.py --download True --cameraDir D:/
Once you have downloaded your data, you should have a folder of .JPG files of all the activities you have been up to since you started wearing the camera. By default, this will be in the scripts/camera/test folder. Check that you have successfully downloaded your data
To then wipe the data from your camera, run:
python autographer.py --delete True --cameraDir D:/
Continue here
Typically, we annotate data from multiple partipicipants, and the browser expects the image data to be across multiple folders, each specific to a participant. In order to emulate the expected format,
image_root_dir/ P001/   B<img_number><img_timestamp>.JPG
                        ...
                P002/   B<img_number><img_timestamp>.JPG
                ...     ...
create a new folder under browser/data called my_cameraand within my_camera, a folder P001 where you move all of your .JPG files to.
0.2 Downloading accelerometer data
To download the accelerometer data, plug in the accelerometer into your computer using the provided cable. You should notice data from the accelerometer popping up under D:/ for Windows or under /Volumes/ for Mac. Copy the .CWA file from the accelerometer to a folder such as browser/data/my_accelerometer.
You can then delete the .CWA file on the device, and eject the device.
At this stage, return the camera-logger, accelerometer and micro-usb to your tutor.
1. Creating a schema
In order to annotate each image taken by the camera, we need a set of annotations to choose from. This set of possible annotations is called the annotation schema. For detailed annotations of physical activity, we tend to use the compenidum of physical activity to inform our annotation schema.
However, we are going to let you come up with your own annotations. In order to do this, you are going to edit the my_schema.csv file under browser/data. You can edit this file within any tabular data editor, such as Microsoft Excel, or even just TextEdit. Each annotation needs to be on a new line. You will notice that we have already included the annotations: bicycling, mixed, sleep, sit-stand, vehicle, and walking. We suggest you keep these annotations and add additional ones, perhaps clarifying certain activities, or describing activities not included in the provided annotations.
Discuss what makes a good annotation schema. Should each image be uniquely described by a single label, or should multiple labels apply to each image?
2. Annotation
Now that we have downloaded and processed our camera data, and we have an annotation schema, we can start applying the labels from the schema to our data.
Navigate to the browser folder in the code you previously downloaded. We will assume that the sensorsetup conda environment is still active.
Now, if everything is correctly set up, you should be able to run:
python main.py
and the following selection menu should pop-up:
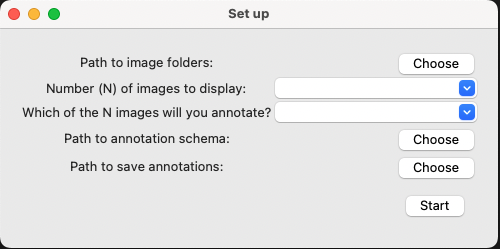
Set the path to the root of the image folders (browser/data/my_camera, NOT browser/data/my_camera/P001)
Set how many images you want to display at a time (we recommend 3), and which image in that sequence you want to annotate (we recommend the middle image, which will have index 1, because of zero-indexing).
Set the path to your annotation schema (browser/data/my_schema.csv).
Lastly, set the path to where you want to save your annotations, for instance (browser/data/your_annotations.csv).
If you have set this all up correctly, then when you click start, you should be presented with a screen that looks like:
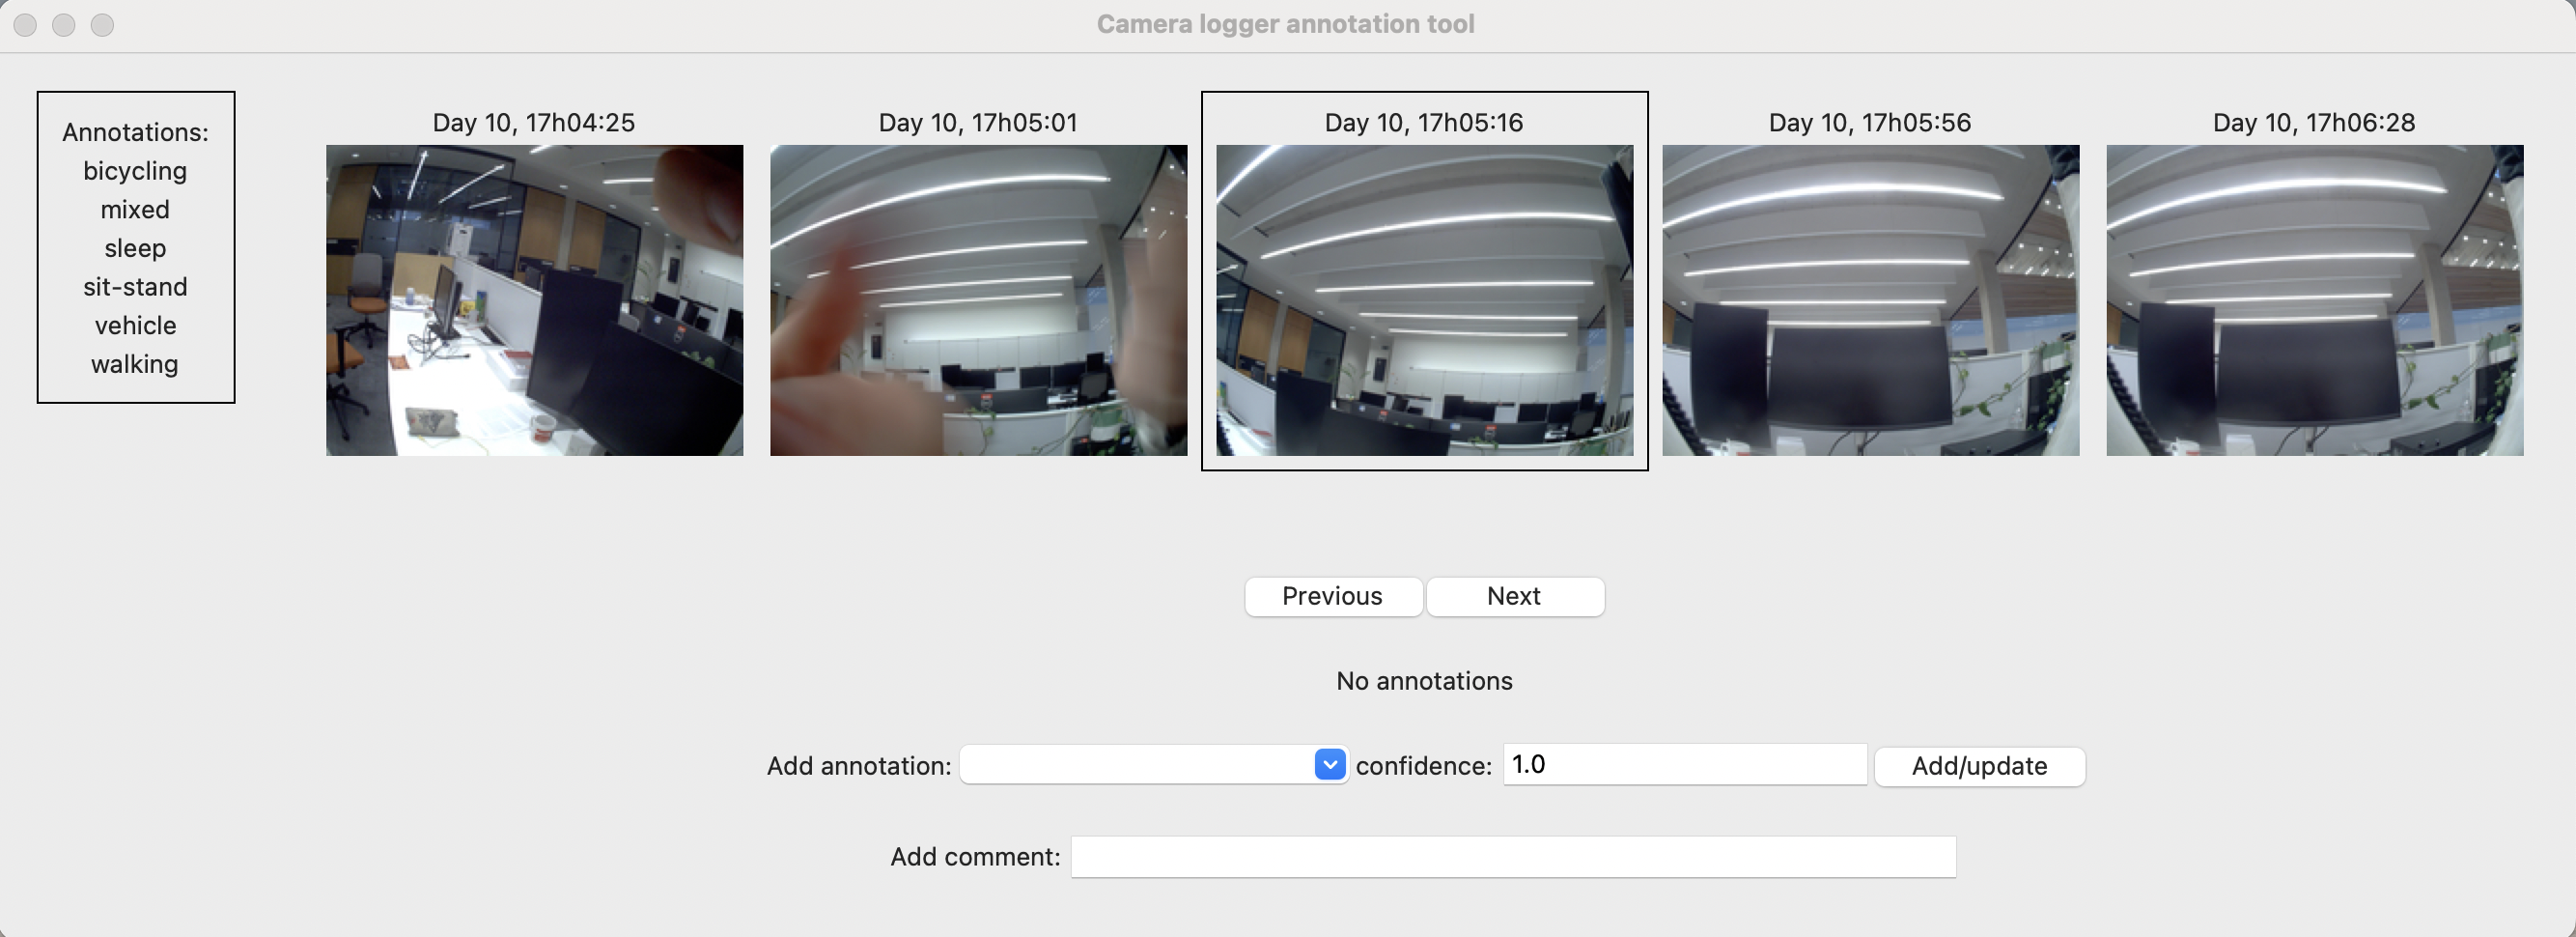 On the left of the screen is the list of annotations you can apply to each image, in the middle are the images from your camera logger, with the image that you are currently applying annotations to outlined. Below it are controls which allow you to go to the next or previous image (if you haven’t reached the end), and a drop down menu which allows you to add an annotation to the current image. By default, each annotation is added with a “confidence” of 1. However, you can choose any number between 0 and 1 to describe how confident you are of a particular annotation. You can associate multiple annotations with each image. Finally, you can also write textual comments.
Annotate as many images as you have energy for (this is a time consuming process).
Once you have reached the end of the images, or have run out of steam, notice that the applicaiton has automatically save your annotations to the specified file your_annotations.csv. You can open this file in any tabular data editor. It has the format:
| time | id | path | comments | label 0 | label 1 | … | label N |
|---|---|---|---|---|---|---|---|
np.datetime64 |
int |
str |
str |
float [0,1] |
ditto label 0 | … | ditto label 0 |
where label 0 to N are the annotations in your annotation schema, and the value under label i for a particular row is the confidence that a particular image (the one that can be found at the image path) demonstrates label i.
At this stage, you have annotated your own camera data.
Reflect on how we can improve the camera annotation process. How can machine learning assist in this process and enable faster annotation. Are there any risks with incorporating machine learning? How do we deal with bias introduced by the annotator, including biases that arise from practical issues such as fatigue from annotating many images.
If you have made it this far, and feel like you have had enough discussion, you can try and match up your camera informed annotations with the data from your wrist-worn accelerometer. In order to process the accelerometer data, look into the package actipy.